Imagine you’re buying a used car. You wouldn’t just look at the paint color, right? You’d check the mileage, engine condition, accident history, and price compared to similar cars.
Evaluating stocks works the same way.
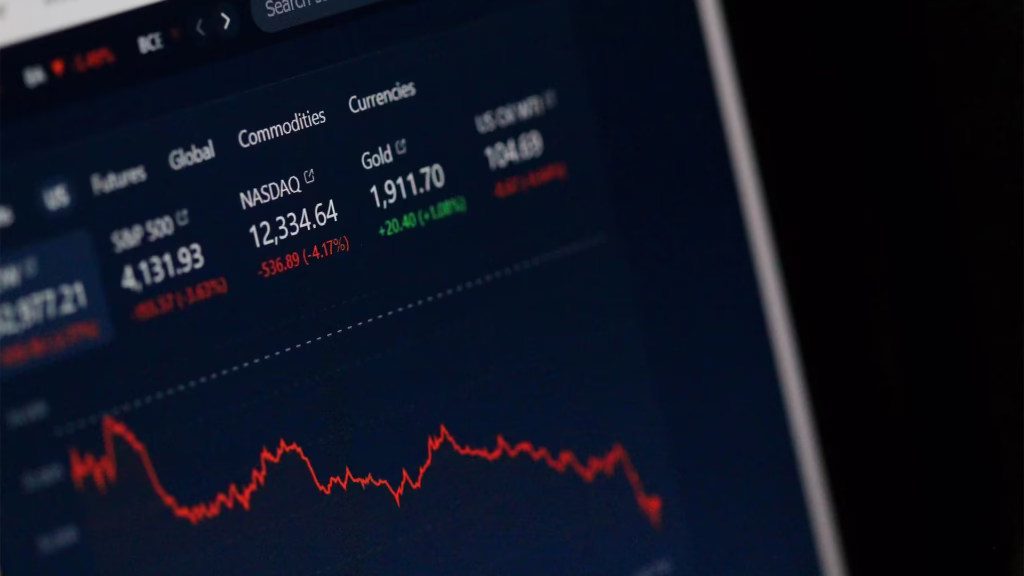
A stock’s price tells you almost nothing. Apple at $254 per share… is that expensive or cheap? You can’t tell until you look at the numbers behind that price.
Stock metrics are like the car’s inspection report. They tell you what you’re really getting for your money. Let’s learn how to read them.
Reading a Stock Quote: Your First Stop
Before diving into metrics, you need to know where to find the information. Every stock has a “quote” – a snapshot of key data.
Real Example: Apple Inc. (AAPL) – October 2025
Here’s what you see when you search “AAPL stock”:
AAPL – Apple Inc.
$254.17 ▲ +2.35 (+0.93%)
Open: $251.82
High: $255.72
Low: $251.63
Mkt Cap: $3.84T
P/E Ratio: 31.25
EPS: $8.13
Dividend Yield: 0.43%
Volume: 45.2M
Avg Volume: 52.8M
52-Week High: $258.90
52-Week Low: $164.08
Beta: 1.24
Confused? Don’t worry. Let’s break down every single number.
The Basics: Price Information
Current Price: $254.17 What someone is paying for one share right now. Changes every second during market hours.
Change: +2.35 (+0.93%) How much the stock moved today. Green (▲) means up, red (▼) means down. The percentage is more important than the dollar amount.
Open: $251.82 Price when the market opened at 9:30 AM today.
High/Low: $255.72 / $251.63 The highest and lowest prices today. Shows the day’s trading range. Big difference = volatile day.
Volume: 45.2M Number of shares traded today. High volume (lots of activity) = liquid stock, easy to buy/sell. Low volume = harder to trade, prices can swing wildly.
Average Volume: 52.8M Typical daily trading volume. Today’s 45.2M is slightly below average for Apple – normal trading day.
52-Week High/Low: $258.90 / $164.08 The highest and lowest prices in the past year. Shows the stock’s range. If current price is near 52-week high ($254 close to $259), stock is doing well. Near 52-week low would be concerning.
Market Cap: The Company’s True Value
The total value of the entire company.
Formula: Share Price × Total Outstanding Shares
Apple Example:
- Share Price: $254.17
- Total Shares: 15.1 billion
- Market Cap: $3.84 trillion
Why it matters
This number tells you how big the company really is. Remember from Module 4:
- Over $10 billion = Large-cap (Apple, Microsoft)
- $2-10 billion = Mid-cap (Rivian, Spotify)
- Under $2 billion = Small-cap (smaller companies)
The Critical Point: A $20 stock isn’t “cheaper” than a $200 stock. Look at market cap instead.
Example:
Company A:
- Stock price: $500
- Shares: 10 million
- Market cap: $5 billion (mid-cap)
Company B:
- Stock price: $20
- Shares: 1 billion
- Market cap: $20 billion (large-cap)
Company B is actually 4x more valuable even though its stock price is 25x lower!
P/E Ratio: The Most Important Metric
Price-to-Earnings ratio. Shows how much you’re paying for each dollar of profit.
Formula: Stock Price ÷ Earnings Per Share (EPS)
Apple Example:
- Stock Price: $254.17
- EPS (earnings per share): $8.13
- P/E Ratio: 31.25
What this means: You’re paying $31.25 for every $1 of Apple’s annual profit.
How to use it
Low P/E (under 15): Stock might be undervalued (cheap) OR company has problems
Medium P/E (15-25): Fairly valued for most industries
High P/E (over 25): Stock might be overvalued (expensive) OR high growth expected
Real Comparisons (October 2025):
Tesla: P/E of 65 Why so high? Investors expect massive future growth. They’re paying a premium for potential.
Ford: P/E of 6 Why so low? Mature company, slower growth, facing competition. Stock is “cheap” but growth is limited.
Apple: P/E of 31 Between growth and value. Established but still growing. Premium but not crazy.
The Context Matters
Tech companies often have higher P/E ratios (25-40) because they grow faster. Banks and utilities typically have lower P/E ratios (8-15) because they grow slowly.
Compare companies within the same industry, not across different industries.
Warning: A stock with no earnings (losing money) has no P/E ratio. Many growth companies don’t make profit yet – they’re investing everything in growth.
EPS: Earnings Per Share
How much profit the company makes per share you own.
Formula: Company’s Total Profit ÷ Total Shares
Apple Example:
- Total annual profit: $122.8 billion
- Total shares: 15.1 billion
- EPS: $8.13
Why it matters
Higher EPS = More profitable company. But you need to compare:
- This year’s EPS vs last year’s EPS (is it growing?)
- This company’s EPS vs competitors’ EPS
Real Example – Growth Over Time:
Microsoft EPS Growth:
- 2020: $5.76
- 2021: $8.12
- 2022: $9.70
- 2023: $11.18
- 2024: $12.43
- 2025: $13.67 (projected)
Consistent growth year after year = healthy company. This is what you want to see.
Bad Example:
- 2020: $5.00
- 2021: $5.20
- 2022: $4.80
- 2023: $3.20
- 2024: $2.10
Declining EPS = company struggling. Warning sign.
Revenue vs Profit: Know the Difference
Revenue (Sales): Total money coming in from selling products/services.
Profit (Net Income): Money left after paying all expenses.
Formula: Revenue – All Costs = Profit
Real Example: Amazon Q3 2025
- Revenue: $167.7 billion
- Profit: $15.3 billion
- Profit Margin: 9.1%
Why both matter
A company can have huge revenue but tiny profit (or losses). Or high revenue with declining profits.
Tesla Example:
- Revenue: Growing every year (more cars sold)
- Profit: Finally profitable after years of losses
- This is why investors were excited – revenue AND profit growing
Profit Margin: Profit ÷ Revenue × 100
- Under 5% = Thin margins (competitive industry, low pricing power)
- 5-10% = Decent margins
- 10-20% = Good margins
- Over 20% = Excellent margins (strong pricing power)
Industry Examples:
- Grocery stores: 1-3% margin (very competitive)
- Tech companies: 20-40% margin (high-value products)
- Software companies: 25-50% margin (digital = low costs)
Dividend Yield: Income From Stocks
Annual dividend payment as a percentage of stock price.
Formula: Annual Dividend ÷ Stock Price × 100
Coca-Cola Example:
- Annual dividend: $1.84 per share
- Stock price: $63
- Dividend Yield: 2.9%
What this means: If you buy Coca-Cola at $63, you’ll receive 2.9% of your investment back as cash each year.
Comparing Yields:
AT&T: 5% yield High yield, but is it sustainable? Check if the company can afford it.
Apple: 0.43% yield Low yield because Apple focuses on growth, not income.
Microsoft: 0.8% yield Balanced – some dividend, mostly growth.
S&P 500 Average: ~1.5% yield Benchmark to compare against.
Warning Signs:
If dividend yield is over 8-10%, be suspicious:
- Company might cut dividend soon
- Stock price crashed for a reason
- Not sustainable
Good dividend stocks:
- Yield 2-5%
- Consistent or growing dividends
- Profitable company
- Payout ratio under 70% (they can afford it)
Beta: Measuring Volatility
How much a stock moves compared to the overall market.
The Scale:
- Beta = 1.0: Moves exactly with market
- Beta > 1.0: More volatile than market
- Beta < 1.0: Less volatile than market
Real Examples:
Tesla: Beta = 2.1 If market goes up 10%, Tesla typically goes up 21%. If market drops 10%, Tesla drops 21%. Roller coaster ride.
Coca-Cola: Beta = 0.6 If market goes up 10%, Coca-Cola goes up 6%. If market drops 10%, Coca-Cola drops 6%. Stable.
Apple: Beta = 1.24 Slightly more volatile than market. Tech company behavior.
How to use it
High Beta (over 1.5):
- More risk, more potential reward
- Good for aggressive investors
- Examples: Tech stocks, small-caps
Low Beta (under 0.8):
- Less risk, steadier returns
- Good for conservative investors
- Examples: Utilities, consumer staples
Your portfolio should mix both based on your risk tolerance.
Reading It All Together: Real Stock Analysis
Let’s evaluate a stock using everything we’ve learned.
Stock: Microsoft (MSFT) – October 2025
Price: $415
Market Cap: $3.1 trillion
P/E Ratio: 33
EPS: $12.58
Revenue: $245 billion (last 12 months)
Revenue Growth: +15% year-over-year
Profit Margin: 36%
Dividend Yield: 0.8%
52-Week Range: $362 – $430
Beta: 1.15
Analysis
- Market Cap: $3.1T – Massive large-cap, very stable, won’t disappear
- P/E: 33 – Higher than market average (21), but reasonable for quality tech company with growth
- EPS: $12.58 – Strong earnings, check: has grown from $9.70 in 2022 to $12.58 now = consistent growth
- Revenue Growth: 15% – Solid growth for a company this big. Cloud business (Azure) driving it.
- Profit Margin: 36% – Excellent. Software has high margins. Shows pricing power.
- Dividend: 0.8% – Small but growing. Not buying for income, buying for growth + some dividend.
- 52-Week: Currently $415, high is $430 – Near all-time high, stock performing well
- Beta: 1.15 – Slightly more volatile than market, but not crazy. Acceptable for tech.
Conclusion: Quality large-cap tech stock. Fairly valued (P/E of 33 is reasonable for this growth rate). Consistent growth. Strong financials. Good core holding for most portfolios.
Not a bargain, but not overpriced. Would buy for long-term hold.
Red Flags to Watch For
Not every metric is good. Here’s what to avoid:
- P/E over 50 with slowing growth – Overvalued, likely to drop
- Declining EPS year after year – Company struggling, avoid
- Negative profit margins – Company losing money (okay for startups, bad for established companies)
- Dividend yield over 10% – Probably unsustainable, dividend cut coming
- Revenue growing but profit shrinking – Making more sales but less money = bad business model
- Very low volume (under 100K shares/day) – Hard to sell when you want out
- Stock far below 52-week high with no news – Something’s wrong, investigate why
Putting Metrics Into Context
Numbers alone don’t tell the whole story. You need context.
Compare to:
1. The Company’s History Is P/E ratio higher or lower than usual for this company?
Example: If Apple usually trades at P/E of 25-30, and it’s currently at 31, that’s normal. If it suddenly jumped to 50, that’s concerning.
2. Competitors
Example: Streaming Services
- Netflix: P/E 35, Growth 10%
- Disney+: P/E 28, Growth 15%
- Which is better value? Disney+ (lower P/E, higher growth)
3. The Industry Average
Tech Industry Average P/E: 28
- Microsoft at 33: Slightly premium (justified by quality)
- Random tech stock at 60: Overvalued
4. The Overall Market
S&P 500 Average P/E: ~21 If most stocks are at P/E of 21 and you’re buying at 35, you’re paying a premium. Better be worth it.
The Quick Evaluation Checklist
When looking at any stock, ask yourself:
- Is the market cap appropriate for the risk I want? (Large = safer, Small = riskier)
- Is the P/E ratio reasonable compared to growth rate? (High P/E needs high growth to justify it)
- Is EPS growing year over year? (Consistent growth = healthy company)
- Are both revenue AND profit growing? (Need both, not just revenue)
- If it pays dividends, is the yield sustainable? (2-5% is good, over 8% is suspicious)
- Is volume high enough? (Want liquid stocks you can easily sell)
- Is the stock near 52-week high or low? (Context for momentum)
If most answers are positive, dig deeper. If many are negative, probably skip it.
Common Beginner Mistakes
Mistake 1
“This stock is only $5! I’ll buy 1,000 shares!”
Price per share is meaningless. A $5 stock with terrible fundamentals will become a $2 stock. Look at metrics, not price.
Right approach: Check P/E, EPS growth, market cap. Could be $5 because it’s actually worthless.
Mistake 2
“P/E is 50, that’s bad. Won’t buy.”
Context matters. A fast-growing tech company might deserve P/E of 50. A bank with P/E of 50 is overvalued.
Right approach: Compare P/E to growth rate, competitors, and industry average.
Mistake 3
“Company made $10 billion revenue, must be doing great!”
Revenue without profit means nothing. They might be losing money on every sale.
Right approach: Check profit margin. Are they actually making money?
Mistake 4
“Dividend yield is 12%! Amazing passive income!”
Usually means the stock price crashed or dividend is about to be cut.
Right approach: Check if dividend is sustainable. Look at payout ratio and company health.
Mistake 5
“I’ll only look at one metric.”
Using P/E alone (or any single metric) gives incomplete picture.
Right approach: Look at 5-7 key metrics together. Build complete picture.
Practical Example: Should You Buy This Stock?
Let’s evaluate a fictional stock together:
TechGrowth Inc. (Fictional Example)
Price: $180
Market Cap: $50 billion (mid-cap)
P/E Ratio: 45
EPS: $4.00 (was $2.50 last year, $1.20 two years ago)
Revenue: $15 billion (+40% from last year)
Profit Margin: 18%
Dividend Yield: 0% (doesn’t pay dividends)
52-Week Range: $95 – $185
Beta: 1.8
Volume: 5M shares/day
Your Analysis:
- Mid-cap – More risk than large-cap, but room to grow
- P/E of 45 – High! But wait…
- EPS growing fast – $1.20 → $2.50 → $4.00 (more than doubled in 2 years!)
- Revenue +40% – Explosive growth
- Profit margin 18% – Good, and improving (was 12% two years ago)
- No dividend – Makes sense, reinvesting for growth
- Near 52-week high – Stock momentum positive
- Beta 1.8 – Volatile, be prepared for swings
- Volume 5M – Decent liquidity
Verdict: High-growth company with strong fundamentals backing up the high P/E. The EPS growth (doubling) and revenue growth (40%) justify the P/E of 45. This is an aggressive growth stock.
Good for: Young investors, high risk tolerance, long-term horizon.
Not for: Conservative investors, near retirement, need stability.
Decision: Could buy a small position (5-10% of portfolio), but not your whole portfolio.
Why This Matters to You
Understanding metrics changes everything:
Before understanding: “I’ll buy whatever stock my friend recommended. He said it’s cheap at $15!”
After understanding: “Let me check: P/E ratio is 65 with declining EPS, revenue growth is slowing, and profit margins are shrinking. The $15 price is actually expensive for what you’re getting. Pass.”
You’re no longer guessing. You’re analyzing. That’s the difference between gambling and investing.
Let’s Recap
Stock metrics are your evaluation tools. Learn to read them and you’ll make smarter decisions.
- Stock quotes show current price, volume, and price range – gives you the basics
- Market cap tells you company size and risk level – more important than share price
- P/E ratio shows if you’re paying too much for earnings – compare to competitors and growth rate
- EPS reveals profitability per share – track growth over time
- Revenue and profit both need to be growing – revenue alone isn’t enough
- Dividend yield shows income potential – 2-5% is healthy, over 8% is suspicious
- Beta measures volatility – higher = more risk and reward
- 52-week range gives context on momentum – near high is bullish, near low is bearish
- Always compare – Look at company history, competitors, industry average, and overall market
- Use multiple metrics together – Never rely on just one number
What’s Next?
Now that you can read stock metrics, you’re ready to learn:
- How to manage risk in your portfolio
- Diversification strategies
- When to buy and when to sell
- Building your first portfolio
- Investment strategies that match your goals
Understanding metrics is like learning to read a car’s dashboard. You now know what all the gauges mean. Next, you’ll learn how to drive – how to actually build and manage a portfolio.
Remember: This is educational content only. Stock metrics are tools, not guarantees. Always do thorough research before investing. Past performance doesn’t guarantee future results.